- 发帖可能变空内容,邪门暂不知所以然
- 『稷下学宫』新认证方式,24年网站打算和努力目标
主题:【原创】选择抗疫模式的一个可能决策依据(知己知彼,百战不殆) -- 学步桥
河里一个长期的话题就是如何选择抗疫策略,常常吵得不可开交。但是在选择之前,一个重要的因素,就是对采取不同策略的后果进行正确,准确的估计。但是由于技术和各种资源限制,直接去获取这个存在困难。这里我给大家介绍一篇今年早些时候发表在《柳叶刀》的文章:Estimating excess mortality due to the COVID-19 pandemic: a systematic analysis of COVID-19-related mortality, 2020–21
作者是一个集体COVID-19 Excess Mortality Collaborators,领头的是王海东,一位在美国的华人,北大本硕,美国博士,美国工作。
对超额死亡估计的文章汗牛充栋,为什么拿这篇来说事呢,一方面是参与者众多,数据比较充分;另一方面是方法比较可靠。我说一下我觉得比较重要的因素,大家有兴趣可以看原文:
1 对延迟统计,未注册的全因死亡数据进行了矫正。并且剔除了因热浪袭击导致大量死亡的数据。再好的模型也不能在错误数据上做出好结果。这些举措很重要。
2 文中采取了多个模型,分别利用2019.2以前数据对3.2019-2.2020进行估计,然后拿实际数据去打分,根据估计的成绩来做权重,用在对1.2020-12.2021的超额死亡估计上,数据是这之前(上至)11年的历史数据。
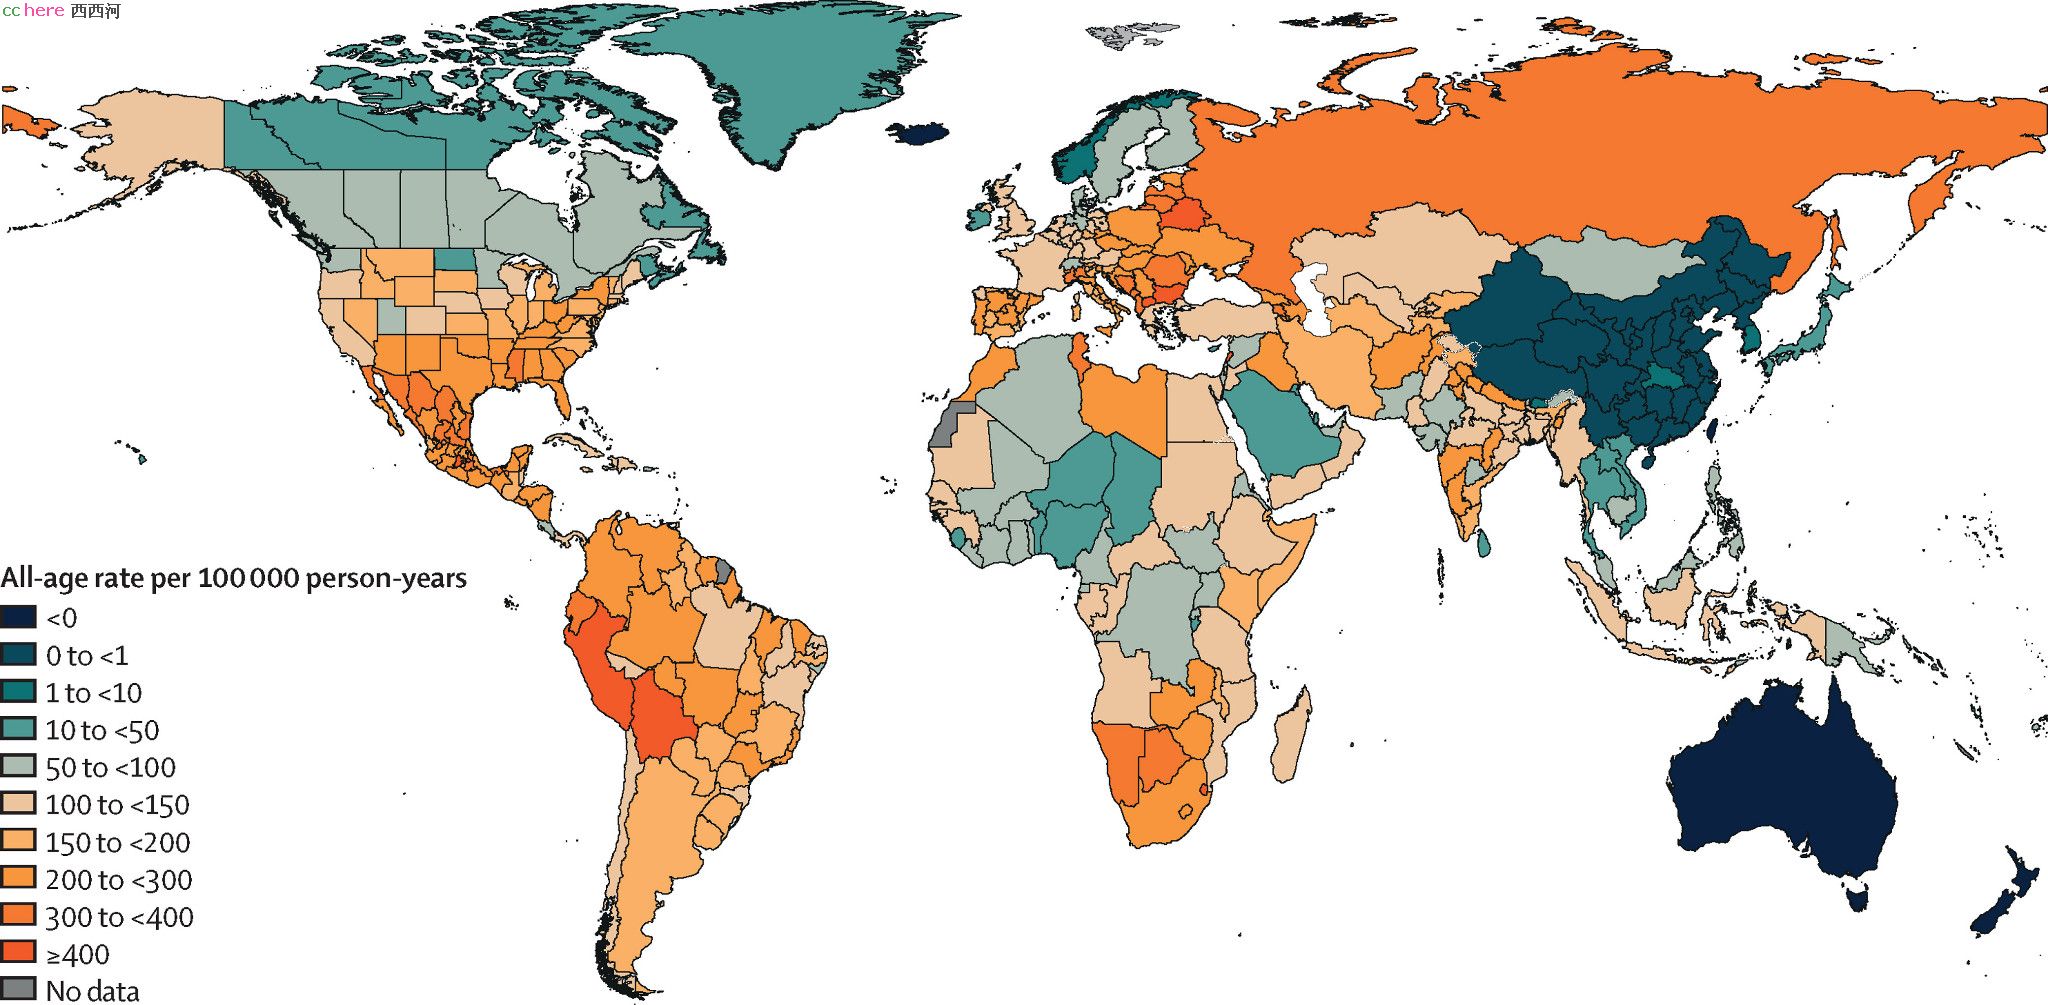
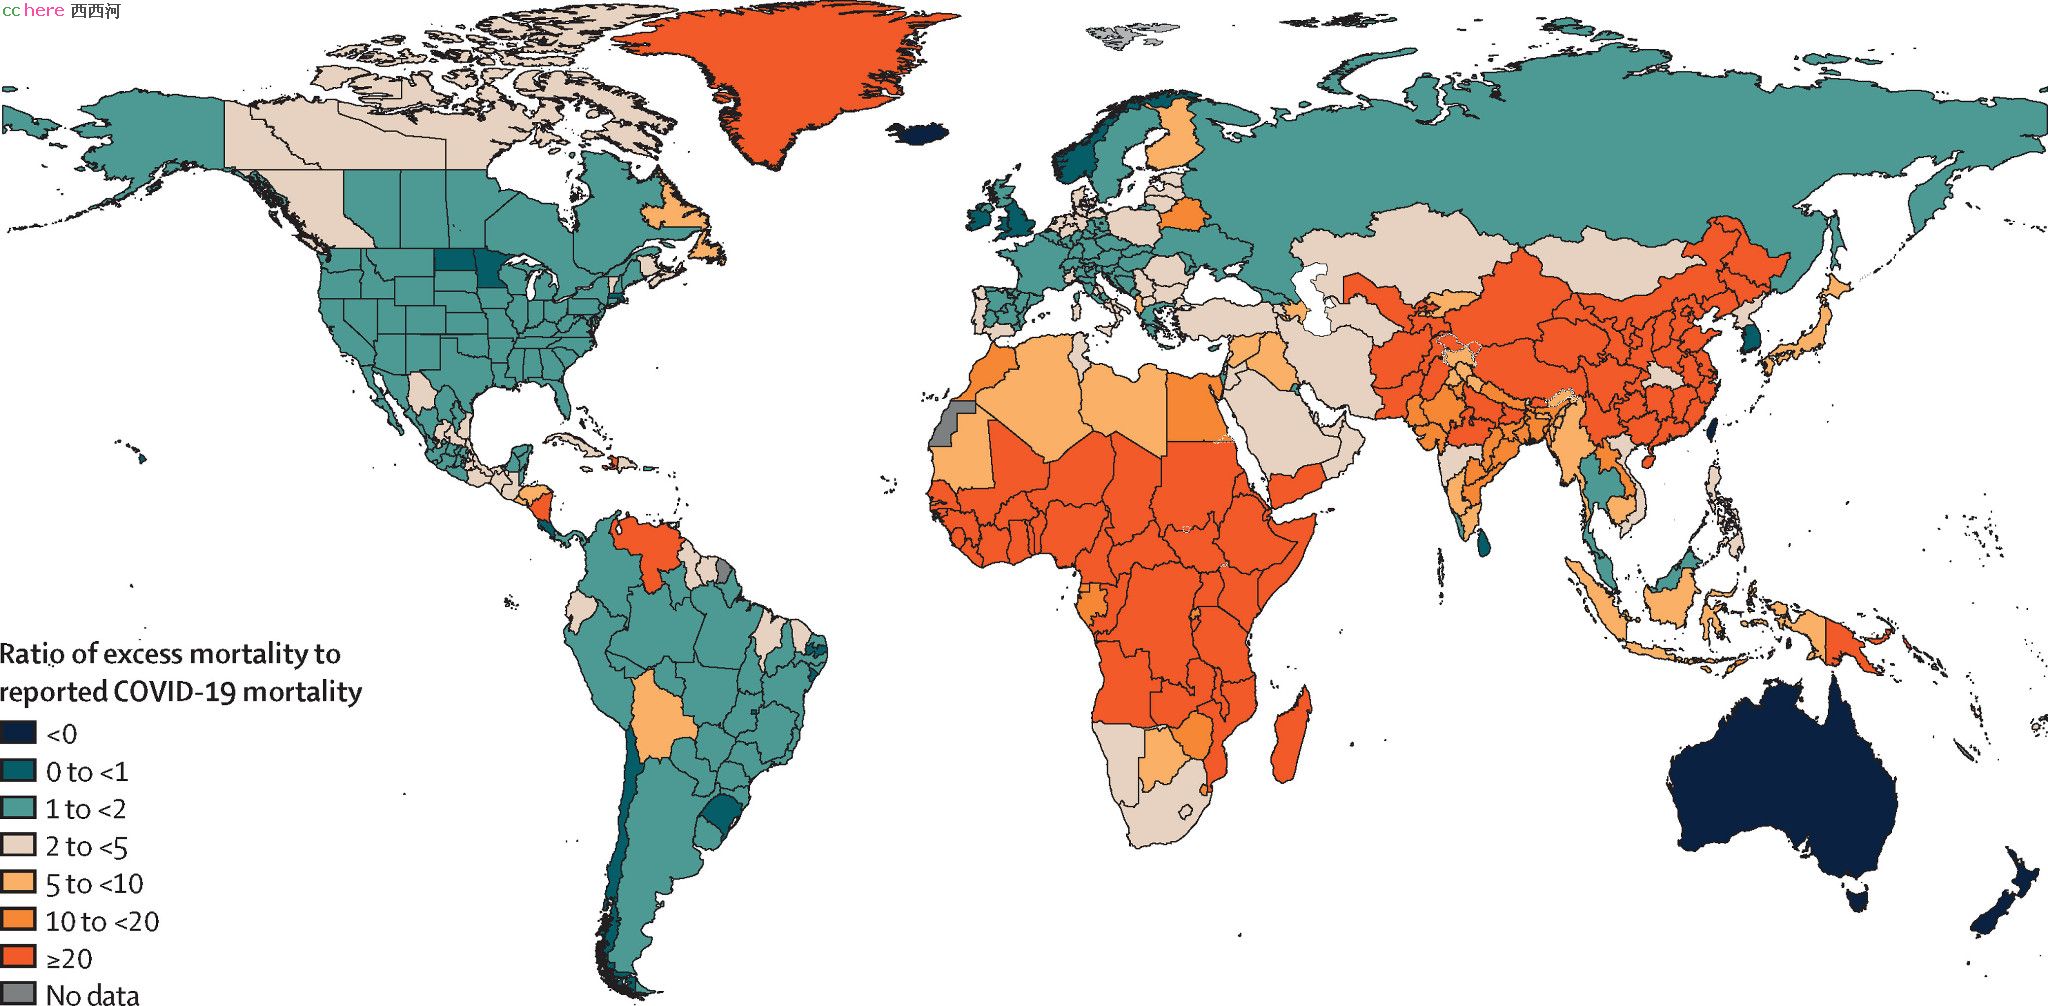
关于中国数据,该文估计中国十万人超额死亡在湖北是9.4,湖北之外是0.3,综合是0.6。超额死亡跟实际报告人数比,湖北是2.34倍,其他地方23.57倍,综合是3.71倍。总的来说,我们的抗疫成绩很好,但是统计部门还是差点意思(不一定都是技术原因)。这个对比可以从下面两幅世界地图上清晰看到。前一张是超额死亡数据的世界地图,后一张是和实际报告死亡人数的差距倍数的世界地图。
我个人的理解,对于从已知数据推断未知数据,就是要先寻找“变化中的不变性”(引号内是一位老先生的名言)。这个不变性可能不仅仅是简单的恒常性,甚至可能不是线性。
所以从历史的死亡人口估计没有特定新因素影响下的预期死亡人口才有了不同的模型,他们对于“不变性”是有不同的理解的。而细化的输入,可以让模型预期的不变性更接近真实世界。比如假设《每个人死亡概率一样》就没有假设《每个同年龄的人死亡概率一样》精确,后者又没有假设《每个同年龄且同收入的人死亡概率一样》精确。
但越精确的模型,需要输入数据越精细。主贴的引文因为要全球比较,未必有条件得到非常详细的数据,如人口中年龄、收入、基础疾病、医疗水平等等分布情况。很多网友提出,第一年基础病严重的脆弱人群已经死了,第二年数据就不一样,就算是一个例子。在有限数据下,主贴引文中的处理,就是引入多个模型,对一些数据估计后根据估计的好坏进行加权平均,思路简单但是确实有不少优点。
现在很多网友在根据数据估计差额死亡,我建议大家参考一下该文的方法,而不是简单认为每年就该死一样多的人,或者每年死的人要走同样的趋势。
To estimate expected mortality, we developed six models, each fit separately by location. The first four models were based on first estimating the weekly (or monthly) seasonal pattern of mortality and then estimating the time trend in weekly or monthly mortality not explained by seasonality. We used a Bayesian spline to estimate the weekly seasonal pattern for each location using data from 2010, or the earliest year after 2010 when such data first became available, until around February, 2020, when the COVID-19 pandemic started for each location (appendix p 48). Second, using the same Bayesian spline, we estimated the time trend in the residuals (additional details provided in the appendix, pp 38–40). By combining the seasonal and secular trends, we generated predictions of the expected level of mortality in 2020 and 2021.
The specification of the spline can have a sizeable impact on the estimated expected mortality for a particular location. To make the results more robust to model specification, we included in our ensemble four variants according to where the second to last knot in the spline was placed: 6 months, 12 months, 18 months, and 24 months before the end of the period for the input data before the COVID-19 pandemic started for each location. We also included in the ensemble a Poisson model with fixed effects on week and year, and a model that assumed that expected mortality for 2020 and 2021 was the same as the corresponding weekly mortality observed in 2019. To derive weights for the different models in the ensemble, we assessed how each model performed in an out-of-sample predictive validity test. We fit the model to all data prior to March 1, 2019 and then evaluated how each model performed in predicting mortality between March, 2019, and February, 2020, compared with observed mortality in the same time period. We then weighted component models in the ensemble using 1 over the root mean squared error (RMSE) of the predictions for each component to down-weight component models with larger RMSE (and thus less accurate predictions) in the ensemble. A global weighting scheme was used for all locations. The distribution of RMSE by location for each of the six models included in the model ensemble and examples of the estimated excess mortality for each component model are provided in the appendix (p 49). Expected mortality from the ensemble model was subtracted from observed mortality in 2020 and 2021 to estimate excess mortality due to the COVID-19 pandemic.
- 相关回复 上下关系8
🙂【原创】选择抗疫模式的一个可能决策依据(知己知彼,百战不殆)

🙂关于超额死亡率计算方法 10 学步桥 字3942 2022-11-25 07:05:43
🙂就我们国家的数据 13 龙牡 字700 2022-11-25 07:16:24
🙂全面看待新冠的影响,死亡率不是全部 23 牛得很 字1791 2022-11-24 21:45:56
🙂数据测算之前,我没法说结论 8 学步桥 字491 2022-11-25 06:32:52
🙂这个估计已经在制定规划当中了 6 普鲁托 字773 2022-11-25 09:07:22
🙂英国21年初就是按照血氧操作 14 MaverickZ 字239 2022-11-25 07:11:52
🙂这个指标是不是有误? 2 sywyang 字454 2022-11-25 16:02:28